ExpressQuantumGrid provides its users with a very useful feature called
Summaries. It allows you to calculate totals against a group of records
or all the records and represent the results in a convenient form.
The grid control gives you the ability to calculate five built-in
summaries:
- Sum
- Average of values
- The number of records
- Maximum value
- Minimum value
It is possible to calculate more complex aggregate functions which
combine the values of several columns. You are also able to exclude
specific rows (containing NULL, for instance) and change the summary
results.
There are two summary types available: Footer and Group
summaries.
¶ Footer Summary
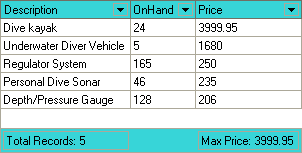
Calculated against all records within an entire grid control. In the
following image, two footer summaries are provided: the first displays
the total number of records in the grid control; the second one displays
the maximum value of the last column.

¶ Group Summary
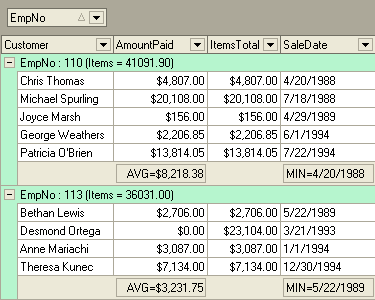
A type of summary calculated against records within a specific group.
You can calculate group summaries when data is grouped by any grouping
item in Table View. The following image demonstrates grouping by the
EmpNo column.
The AmountPaid, ItemsTotal, and SaleDate columns calculate group
summaries. Summary values for the AmountPaid and SaleData columns are
displayed within the group footer panel, while the summary by the
ItemsTotal column is displayed within the group rows.
